


Trace One put out a new infographic for the data report they recently released about the grocery store items that have increased the most in price over the last few years.
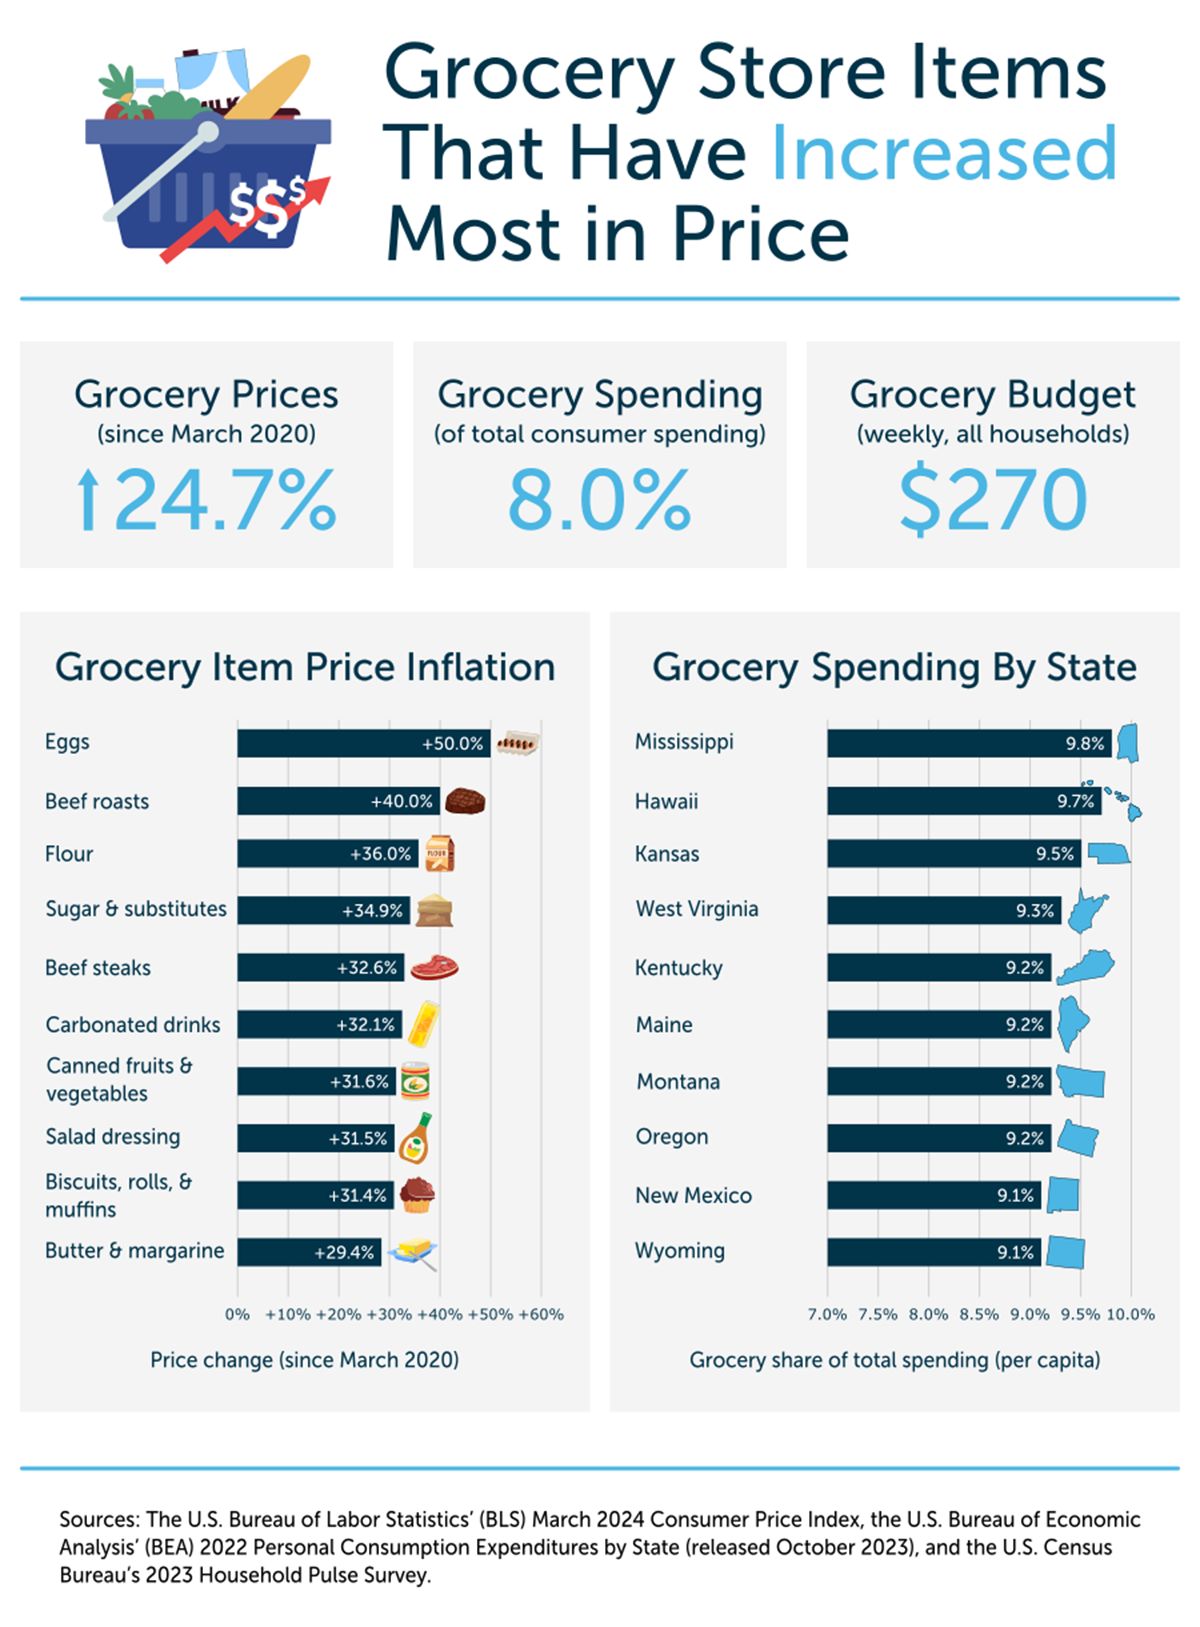
In this report, researchers calculated the percentage change in CPI between March 2020 and March 2024 across the most common grocery (food at home) items, and then ranked the grocery store items accordingly. The full report also has a complete breakdown of grocery spending for all 50 states, including the grocery share of total consumer spending and weekly grocery spending by state.
Here is the new infographic: